Building a Homelab Dashboard That Does Not Care If the GPU Box Is Off
I was standing in a parking lot trying to remember whether my AI workstation was even turned on. I’d left the house without checking, and now I needed to know if a monitor was actually down or just quiet, whether a model I’d been testing was still the current build, and whether it was worth the drive home to fix something versus just waiting. My phone had no good way to answer any of that. Uptime Kuma lives on one box, the model configs live on another, and neither one is exactly a mobile-friendly experience over a VPN connection.
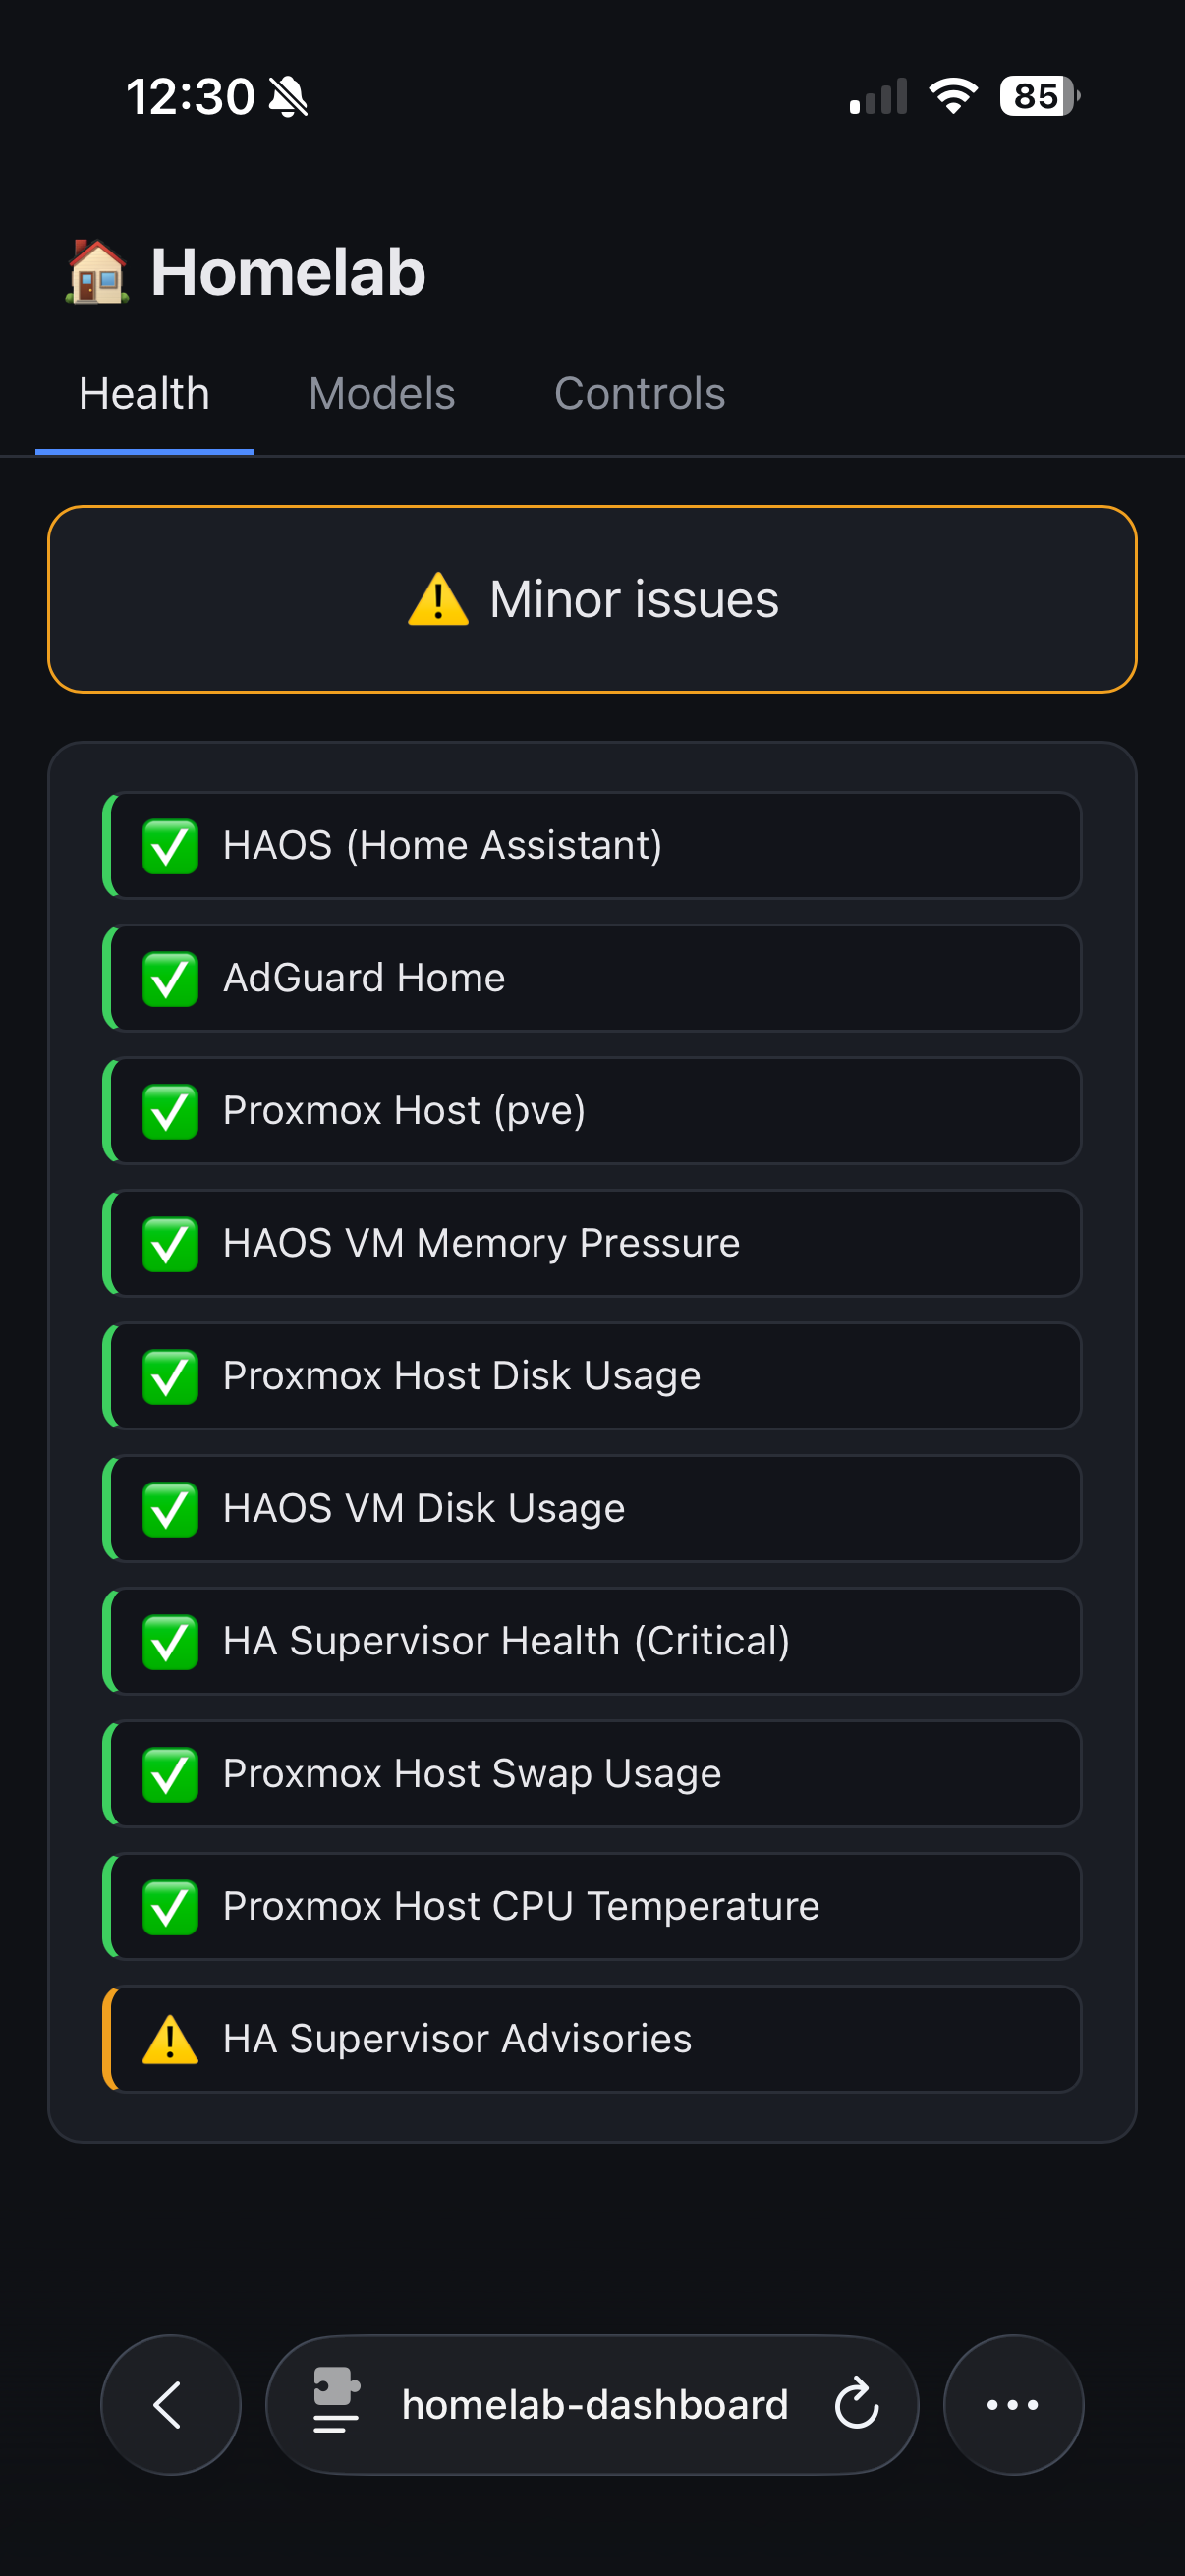
So I built a dashboard. Not a fancy one. A single page, three tabs, chips instead of tables, dark theme, nothing to log into. The interesting part isn’t the UI. It’s the three decisions that shaped it: where it lives, how it learns about the workstation’s model lineup without that workstation being reliably on, and the one piece I still haven’t wired up.
The Dashboard Lives Next to Home Assistant Not Next to the GPU
The obvious place to run a homelab dashboard is the same machine doing the interesting work, in my case the AI workstation with the GPU. I didn’t do that. I put it on the Proxmox box instead, in its own small container, right alongside the Home Assistant VM and the Uptime Kuma instance it needed to talk to.
The reasoning comes down to one fact: the AI workstation is not always on. It draws real power running a 30B-class model, so it sleeps or shuts down when I’m not actively using it. A status dashboard that lives on the machine most likely to be off defeats its own purpose. The Proxmox box, by contrast, is the thing that’s always running. It’s already the host for the smart home and the uptime monitor, so it’s already the thing I trust to answer “is everything okay” honestly.
I gave the new container its own identity on the private network rather than routing through the workstation, so my phone can reach it directly regardless of what state the GPU box is in. Getting there required opening up a device the container’s virtualization layer doesn’t expose by default, but that’s a one-time setup cost, not an ongoing one.
Uptime Kuma Doesn’t Have a REST API so the Dashboard Doesn’t Use One
The Health tab needed to answer “what’s monitored and what’s its status” without reinventing Uptime Kuma. The catch is that Kuma’s REST surface is almost nonexistent. There’s a metrics endpoint and not much else. Everything else, listing monitors, reading their state, goes through Kuma’s Socket.io connection, the same one its own web UI uses, authenticated with a real username and password rather than an API key.
That’s a slightly unusual integration path for a dashboard to lean on, but it works, and a background poller means the dashboard’s own page load never blocks on it.
The more interesting problem was less about wiring and more about honesty. One of my monitors flags red every time Home Assistant’s Supervisor notices I don’t have a current backup configured. Kuma only has two states, up or down, and “no backup configured” is not the same class of problem as “the service is unreachable,” but Kuma renders them identically. A dashboard that shows a hard red alert for both trains you to ignore red alerts.
I fixed this with tags instead of name matching. Rather than writing logic that says “if the monitor name contains X, treat it as less severe,” which breaks the moment I rename anything, I added a non-critical tag directly in Kuma and had the dashboard read it. A monitor tagged that way still shows a problem, just in orange instead of red, and the source of truth lives in the same tool where I’d naturally go to manage it. Tags survive renames. String matching doesn’t.
The Model Tracker Pushes on Boot Instead of Polling Live
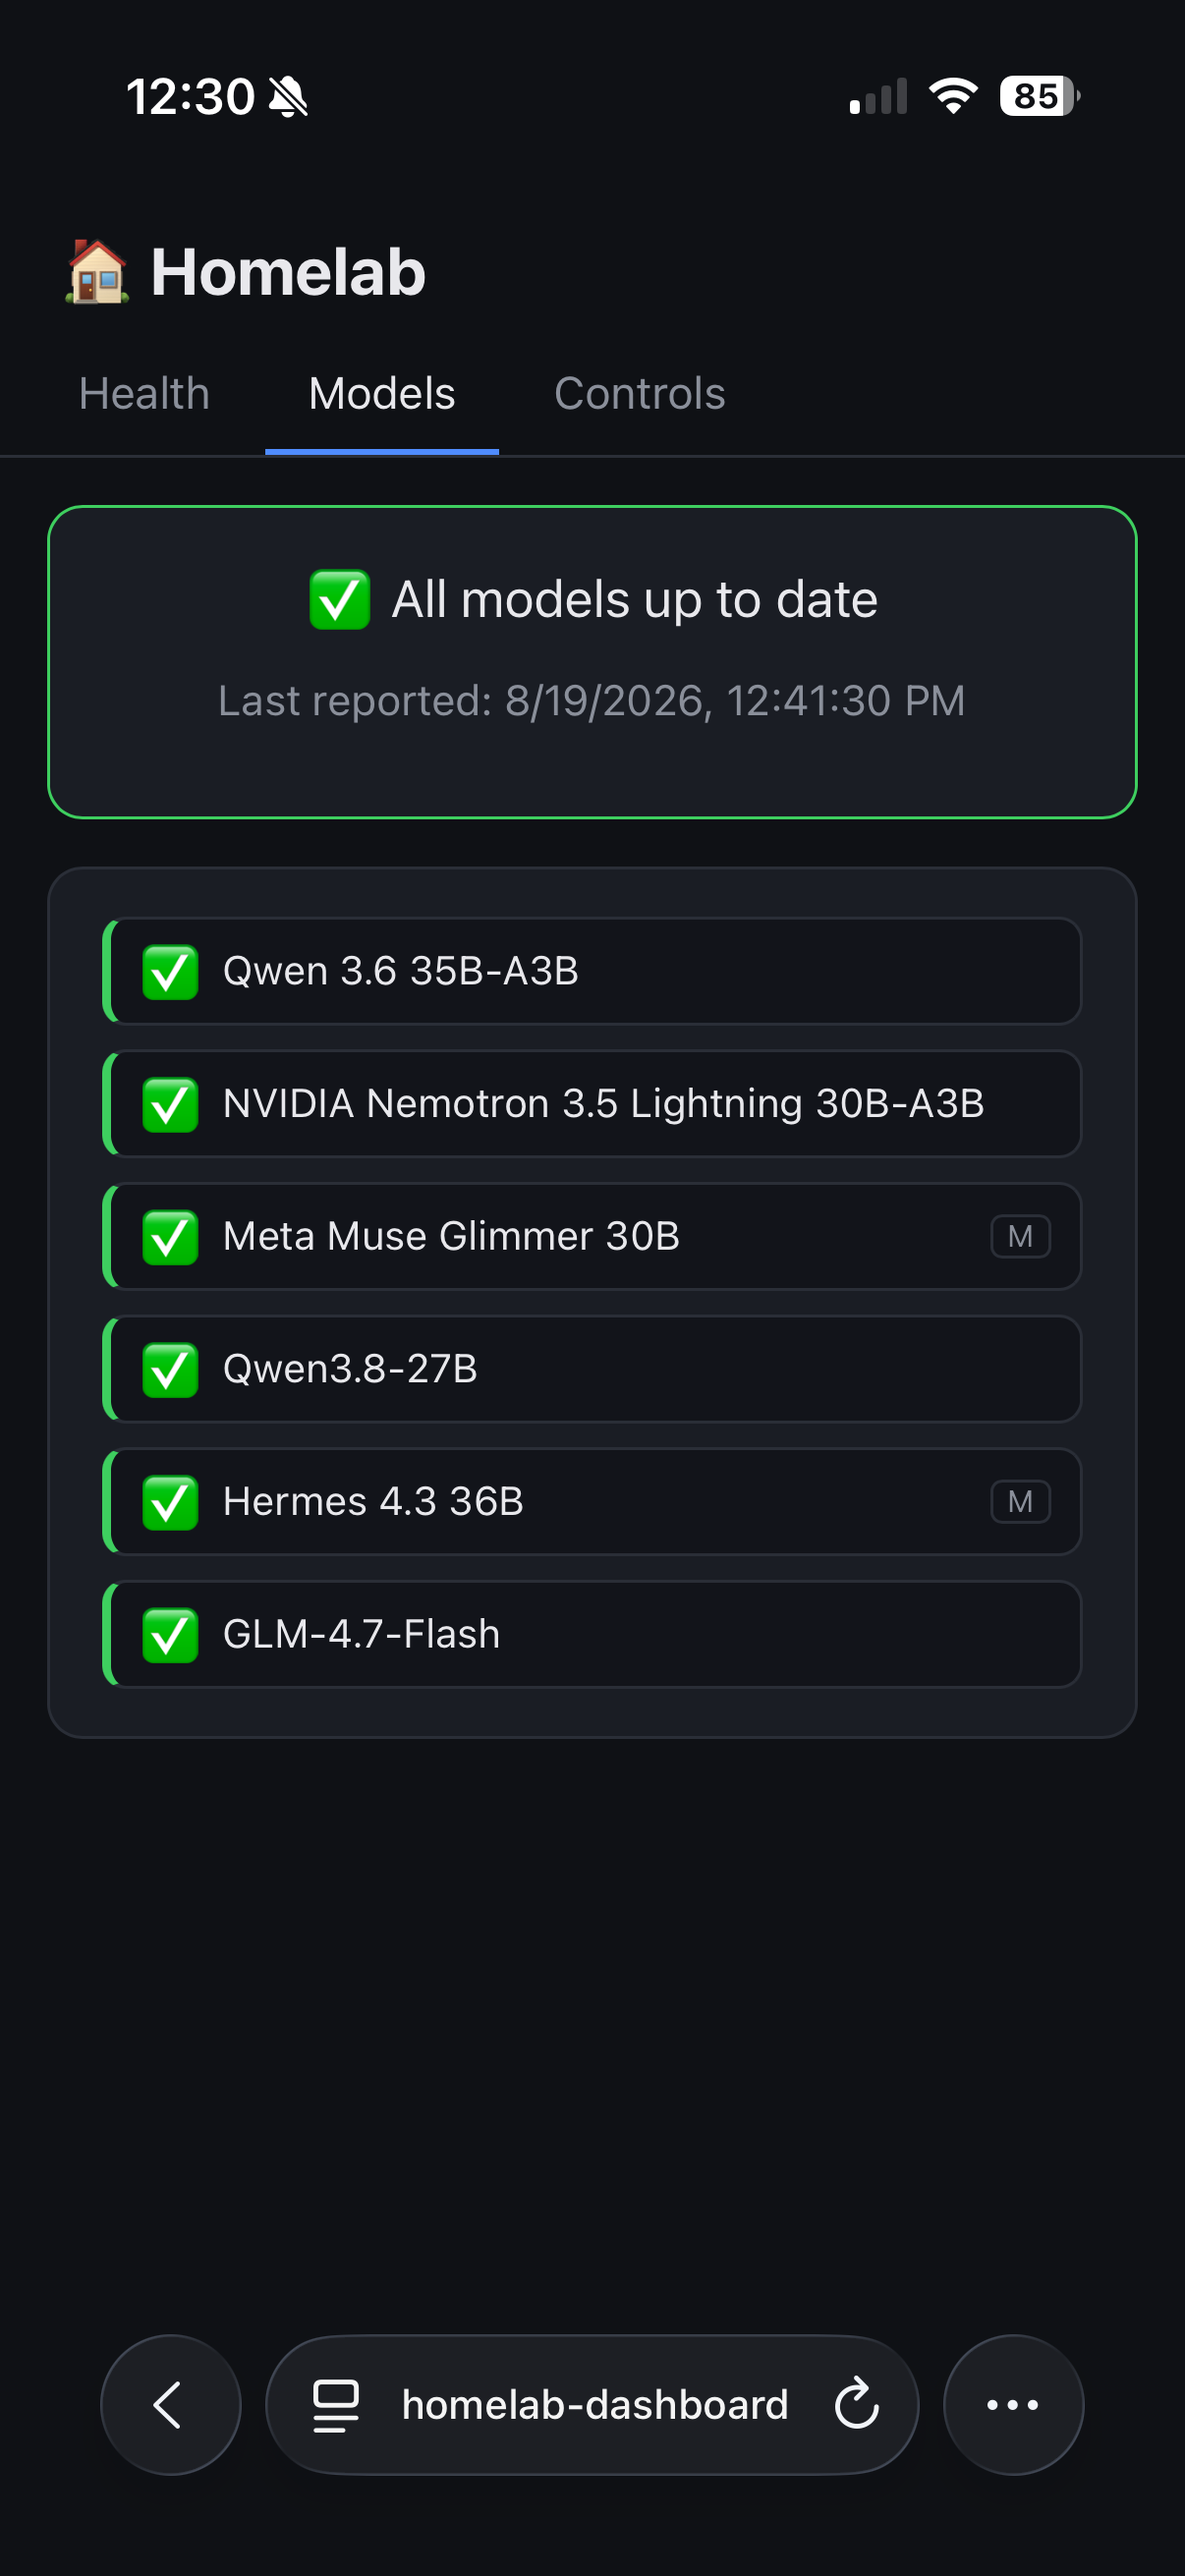
The Models tab exists because I kept losing track of which local LLMs were current builds and which were stale copies I’d forgotten to refresh. The hard constraint here is the same one that shaped where the dashboard lives: the workstation holding the models isn’t always on, so any design assuming the dashboard can reach out and ask it something live is going to spend half its life showing nothing.
So it works the other way. A small script runs once at boot on the workstation, reads the local model configuration, works out where each model’s file came from, checks whether that source has moved since the last boot, and pushes a single report to the dashboard. The dashboard just displays whatever it was last told, along with an explicit last-reported timestamp instead of implying the data is live. If the workstation has been off for three days, the dashboard says so instead of quietly serving three-day-old data as if it were current.
The freshness check itself compares a source repository’s current version against whatever version was recorded the last time the script ran. That’s a real limitation worth naming: it’s a change-detection signal since the last check, not a guarantee that what’s installed is the single latest release available anywhere. Good enough to catch drift, not a substitute for actually reading a changelog.
The part I like best is that most models don’t need to be told where they came from. GGUF files often carry their own origin metadata, so the script can reconstruct the likely source repository directly from the file and confirm it with one request, falling back to a small manual mapping file only for the handful of models where that metadata isn’t there. I proved this out by adding a brand new model to the workstation days after building the feature, one the script had never seen, and it correctly identified where the file came from without me touching any config.
Phase Three Waking the Workstation from the Couch
This section is a placeholder. Phase three isn’t built yet.
The Controls tab exists in the dashboard already, but every button on it is disabled with a note that wiring is deferred. The idea is straightforward: since the AI workstation is the thing that actually gets turned off, the dashboard should be able to turn it back on and, eventually, shut it down cleanly, without me walking over and pressing a physical button.
I’m holding off on purpose. The Proxmox box, which is the natural sender for a wake signal, is about to move to a different physical location in the house. That’s going to change some of the network topology it currently depends on, and I’d rather build the wake-on-LAN wiring once against the final setup than build it twice. When that move happens, this section gets the real writeup: the wake mechanism, how the dashboard confirms the workstation actually came up rather than just declaring victory after sending a packet, and whatever I inevitably get wrong the first time.
Three tabs, two machines, and a dashboard that’s honest about what it doesn’t know yet, both about the workstation’s power state and about its own missing feature. That feels like the right way to ship something in phases: build what the current physical setup actually supports, and leave a visible, labeled gap where the rest goes once the setup catches up.
What would you build first if your homelab only gave you one screen to check from the couch?
By the Numbers
- 3 tabs shipped: Health, Models, Controls (Controls intentionally stubbed)
- 2 physical machines involved: the AI workstation (models, GPU) and the Proxmox box (dashboard, Home Assistant, Uptime Kuma)
- 1 dedicated container created to host the dashboard, isolated from the services it monitors
- 1 Kuma tag (
non-critical) replacing name-matching logic for severity - 0 REST endpoints available from Uptime Kuma for monitor listing, hence the Socket.io integration
- 1 of 3 planned phases still unbuilt, waiting on a hardware relocation