Stormtrooper Firing Backwards: How Fixing a Fan Dropped Thermals 20 Degrees in a Gaming PC
Stormtrooper is my other Windows gaming machine. It’s a labor of love where I gutted an Alienware PC and repurposed the Core Ultra 9 285K and an RTX 5080 into a tiny Thorzone Nanoq S SFF case. It’s not the homelab server, it doesn’t do inference, it doesn’t host anything — its entire job is to run games and not sound like a leaf blower while doing it.
A few weeks ago I noticed the GPU was running hotter than it should. When I finally opened the case, I found the problem: a fan had been installed backwards, quietly moving air the wrong direction since I built the thing. That discovery turned into four separate thermal test runs, an exhaustive tour of a BIOS menu tree looking for a setting that turns out not to exist on this board, and a fan-curve edit that briefly made the CPU run 18°C hotter than before I “fixed” it.
Here’s the full story, with the numbers.
The Machine
| Component | Detail |
|---|---|
| Hostname | Stormtrooper |
| CPU | Intel Core Ultra 9 285K |
| GPU | NVIDIA GeForce RTX 5080 |
| Motherboard | ASUS ROG STRIX B860-I GAMING WIFI |
| Case | Thorzone Nanoq S |
| Storage | Samsung SSD 990 PRO 4TB |
| RAM | Corsair CMK64GX5M2B5600C40 (DDR5) |
| BIOS | AMI UEFI, version 2.22.1295 |
The Harness
I already had a Linux thermal test harness from the homelab migration post. Porting the concept to Windows meant a PowerShell rewrite, and it took two attempts to get GPU load working reliably.
The first version launched FurMark directly over SSH. It ran, logged sensors, and produced a summary — but the GPU barely noticed. Utilization peaked at 11%, power topped out at 86W. GUI/GPU workloads launched through an SSH service session don’t run in the interactive desktop session on Windows, so FurMark’s rendering never actually touched the GPU.
The fix was a Windows Scheduled Task, the same trick I leaned on when building the Windows Update Butler. Instead of launching FurMark directly, the harness writes a FurMark configuration file and runs schtasks /Run /TN VibeFurMarkAutonomous, which executes the actual stress process inside the logged-in interactive session. That one change took the GPU from an 11%-utilization non-event to a real, repeatable stress load.
The final harness runs six sequential phases — idle, cpu, gpu, combined, storage, cooldown — polling CPU, GPU, NVMe, and DIMM sensors every second via LibreHardwareMonitor and nvidia-smi. A full run is about 65 minutes and produces a per-phase min/max/avg summary for every sensor. I ran this exact harness four times over the course of a month, and the comparisons below are all apples-to-apples across those four runs.
Act One the Backwards Fan
The GPU was hitting 89°C under load. Combined CPU+GPU stress pushed it to 91.8°C at the memory junction. That’s not catastrophic, but it’s not right for an RTX 5080 in a case this size, and the GPU fan was sitting at a flat 31% the entire time — barely responding to the load at all, which was itself a clue that something was wrong with airflow reaching the card, not with the card’s own fan curve.
One case fan was installed backwards. I flipped it and reran the identical harness.
| Phase | Sensor | Before Avg | Before Max | After Avg | After Max | Δ Avg | Δ Max |
|---|---|---|---|---|---|---|---|
| GPU | GPU core | 82.7°C | 89.0°C | 66.6°C | 70.0°C | -16.1 | -19.0 |
| CPU package | 52.1°C | 61.0°C | 50.9°C | 60.0°C | -1.2 | -1.0 | |
| Combined | GPU core | 87.2°C | 89.0°C | 69.0°C | 71.0°C | -18.2 | -18.0 |
| CPU package | 57.3°C | 74.0°C | 55.3°C | 73.0°C | -2.0 | -1.0 | |
| Storage | GPU core | 39.4°C | 71.0°C | 38.7°C | 52.0°C | -0.7 | -19.0 |
| CPU package | 58.6°C | 70.0°C | 57.5°C | 66.0°C | -1.1 | -4.0 |
One fan, turned the right way around, dropped GPU temps 16-18°C on average and up to 19°C at peak, for zero dollars spent. CPU package improved a modest 1-2°C as a side effect of better overall case airflow. NVMe and DIMM temps both improved 1-2°C across the board for the same reason.
A few honest caveats before I call this a clean win:
- The two runs were about a month apart, and I didn’t log ambient room temperature for either one. A cooler room on the “after” day would inflate this result. I don’t think that’s what happened here — the GPU-specific magnitude of the improvement is too large and too phase-consistent to be pure ambient drift — but it’s a real gap in the methodology.
- The physical fan I corrected was a case fan, not confirmed to be a fan mounted directly on the GPU board itself. The telemetry only reports the GPU’s own onboard fan behavior, which also improved (see below), but that’s consistent with better case airflow reaching the card, not proof the corrected fan was somehow part of the GPU’s own cooler.
- The GPU’s own fan response is the strangest data point here. At a flat 31% while the core sat at 89°C in the “before” run, the card’s own curve should have been ramping harder than that. After the fix, the same fan curve settled into 55-59% at a cooler 66-70°C. I don’t have a clean explanation for why the fan was so passive while the card was this hot before the fix — possibly a curve applied at the time that I’ve since lost track of, possibly bad airflow creating a hot pocket that the card’s temperature sensor didn’t fully reflect until it was too late in the sample window. Flagging it rather than pretending I understand it.
- GPU power went up, not down, after the fix: +11.5W average in the
gpuphase, +20.0W incombined. This is the opposite of what happened in the homelab’s custom-loop migration, where a cooler GPU pulled less power. Here, a cooler card apparently had more thermal headroom to sustain higher boost states for longer, so it drew more power doing more work rather than the same work more efficiently. Both are legitimate outcomes of the same underlying mechanism — a chip with thermal headroom will use it, one way or another.
Act Two Hunting a Voltage Knob That Isn’t There
With the fan fixed, the obvious next lever was undervolting. Lower voltage, same clocks, less heat, in theory. I went in with a hypothesis: a -60mV global CPU offset, a restored 250W PL1/PL2 power limit if the board had been running unlocked, and an 875-900mV RTX 5080 curve via MSI Afterburner. None of that survived contact with the actual BIOS.
The Core Ultra 9 285K is built on Arrow Lake, which did away with the old Fully Integrated Voltage Regulator that every “-60mV global offset” undervolting guide from the last decade assumes exists. Arrow Lake instead uses an external motherboard voltage regulator feeding individual per-block Digital Linear Voltage Regulators — one for each P-core, each E-core cluster, and the Ring. In theory you undervolt those per-block DLVRs, or nudge specific points on the factory voltage/frequency curve, not set one flat global number.
In practice, on this board, none of that is exposed at all. I went through the BIOS menu by menu:
- Ai Tweaker → Tweaker’s Paradise: ratio controls,
Actual VRM Core Input Voltage, CPU Graphics/SA/memory-controller voltages, DRAM voltages. No P-core, E-core, or Ring DLVR voltage field anywhere. - Ai Tweaker → Internal CPU Power Management: this is where I found the actual power limits —
Current Long Duration Package Power Limit: 250 Watt,Current Package Power Time Window: 56 Sec,Current Short Duration Package Power Limit: 250 Watt. That’s Intel’s stock spec for the 285K exactly. The board was never running an unlocked profile in the first place, so the “restore PL1/PL2 to stock” step of my plan turned out to be a non-event — a legitimate finding, just not the one I was expecting. - Advanced → CPU Configuration → CPU - Power Management Control: SpeedStep, Speed Shift, C-states, Turbo Mode. No voltage.
- Ai Tweaker → DIGI+ VRM: current capability, VRM switching frequency, power phase control, load-line calibration for the CPU graphics and system-agent rails. Still nothing for CPU core voltage.
- BIOS-wide search for “offset”: ten results, every one of them a PLL voltage offset (Core PLL, Ring PLL, SOC PLL, memory-controller PLL) or a clock-training correction. PLLs are tiny, low-power clock-generation circuits — tuning them is an extreme-overclocking trick for squeezing stability out of unstable ratios, not a thermal lever. Nothing here touches the voltage that actually generates heat under load.
For good measure I tried Intel’s own Extreme Tuning Utility from Windows. It refused to launch its tuning features at all: “system does not support overclocking.” XTU’s clocking and voltage controls have historically been restricted to Z-series boards — Z690, Z790, and now Z890 for Arrow Lake — and the B860-I enforces that same restriction at the driver level, not just in the BIOS.
Conclusion: CPU undervolting is not available on this board, through any interface. Not a bug, not something I missed — a deliberate chipset-tier restriction that Intel and ASUS both enforce. If you want to tune Arrow Lake voltage, you need a Z-series board.
I also skipped GPU curve tuning entirely, even though MSI Afterburner would have let me do it. The honest math didn’t favor it: a curve edit in the 875-900mV range would plausibly buy another 4-9°C, but only while Afterburner is actually running in the background — kill the process, update Windows, or forget to check after a reboot, and the card silently reverts to stock with no warning. A few degrees in exchange for an ongoing operational dependency wasn’t a trade worth making for a machine whose whole point is to not need babysitting.
Act Three the Quiet Idle Curve and the Mistake in the Middle
The last thing on the list wasn’t performance, it was noise. The fan-fixed baseline was already cooling well; I just wanted quieter idle without giving up any of that ramp-up capability under load.
My first pass at the fan curve went too far. I reran the full harness expecting a mild idle improvement and instead got this:
| Phase | Fan-Fixed Baseline Avg/Max | First Quiet-Curve Attempt Avg/Max | Δ Avg | Δ Max |
|---|---|---|---|---|
| idle | 37.3 / 60.0°C | 54.5 / 77.0°C | +17.2 | +17 |
| cpu | 41.4 / 67.0°C | 59.9 / 87.0°C | +18.5 | +20 |
| gpu | 50.9 / 60.0°C | 67.4 / 79.0°C | +16.5 | +19 |
| combined | 55.3 / 73.0°C | 71.5 / 93.0°C | +16.2 | +20 |
| storage | 57.5 / 66.0°C | 74.0 / 83.0°C | +16.5 | +17 |
| cooldown | 39.5 / 56.0°C | 57.0 / 74.0°C | +17.5 | +18 |
The diagnostic detail that mattered: this offset was almost perfectly flat across every single phase — including cooldown, where there’s no load at all. If I’d only touched the low end of the curve for a quieter idle, the gap should have shrunk to nothing once the curve reconverged with its old high-temp ramp under real load. It didn’t. A near-identical +16 to +18°C penalty showed up whether the CPU was doing nothing or getting hammered.
That flatness ruled out the two obvious innocent explanations. It wasn’t ambient temperature — the GPU, sitting in the same case breathing the same air, stayed exactly where it was supposed to be (and was actually 3-5°C cooler than baseline in the gpu and combined phases, since its curve is independent and untouched). And it wasn’t a load-dependent curve shape issue, because a curve edit confined to idle behavior would have produced a shrinking gap at higher temperatures, not a constant one. The likely explanation: whatever fan or fan zone I edited had its duty cycle reduced across its entire operating range, not just the quiet-idle segment I intended to touch.
I went back into the BIOS’s Q-Fan Control screen and rebuilt the CPU_FAN curve point by point instead of eyeballing it:
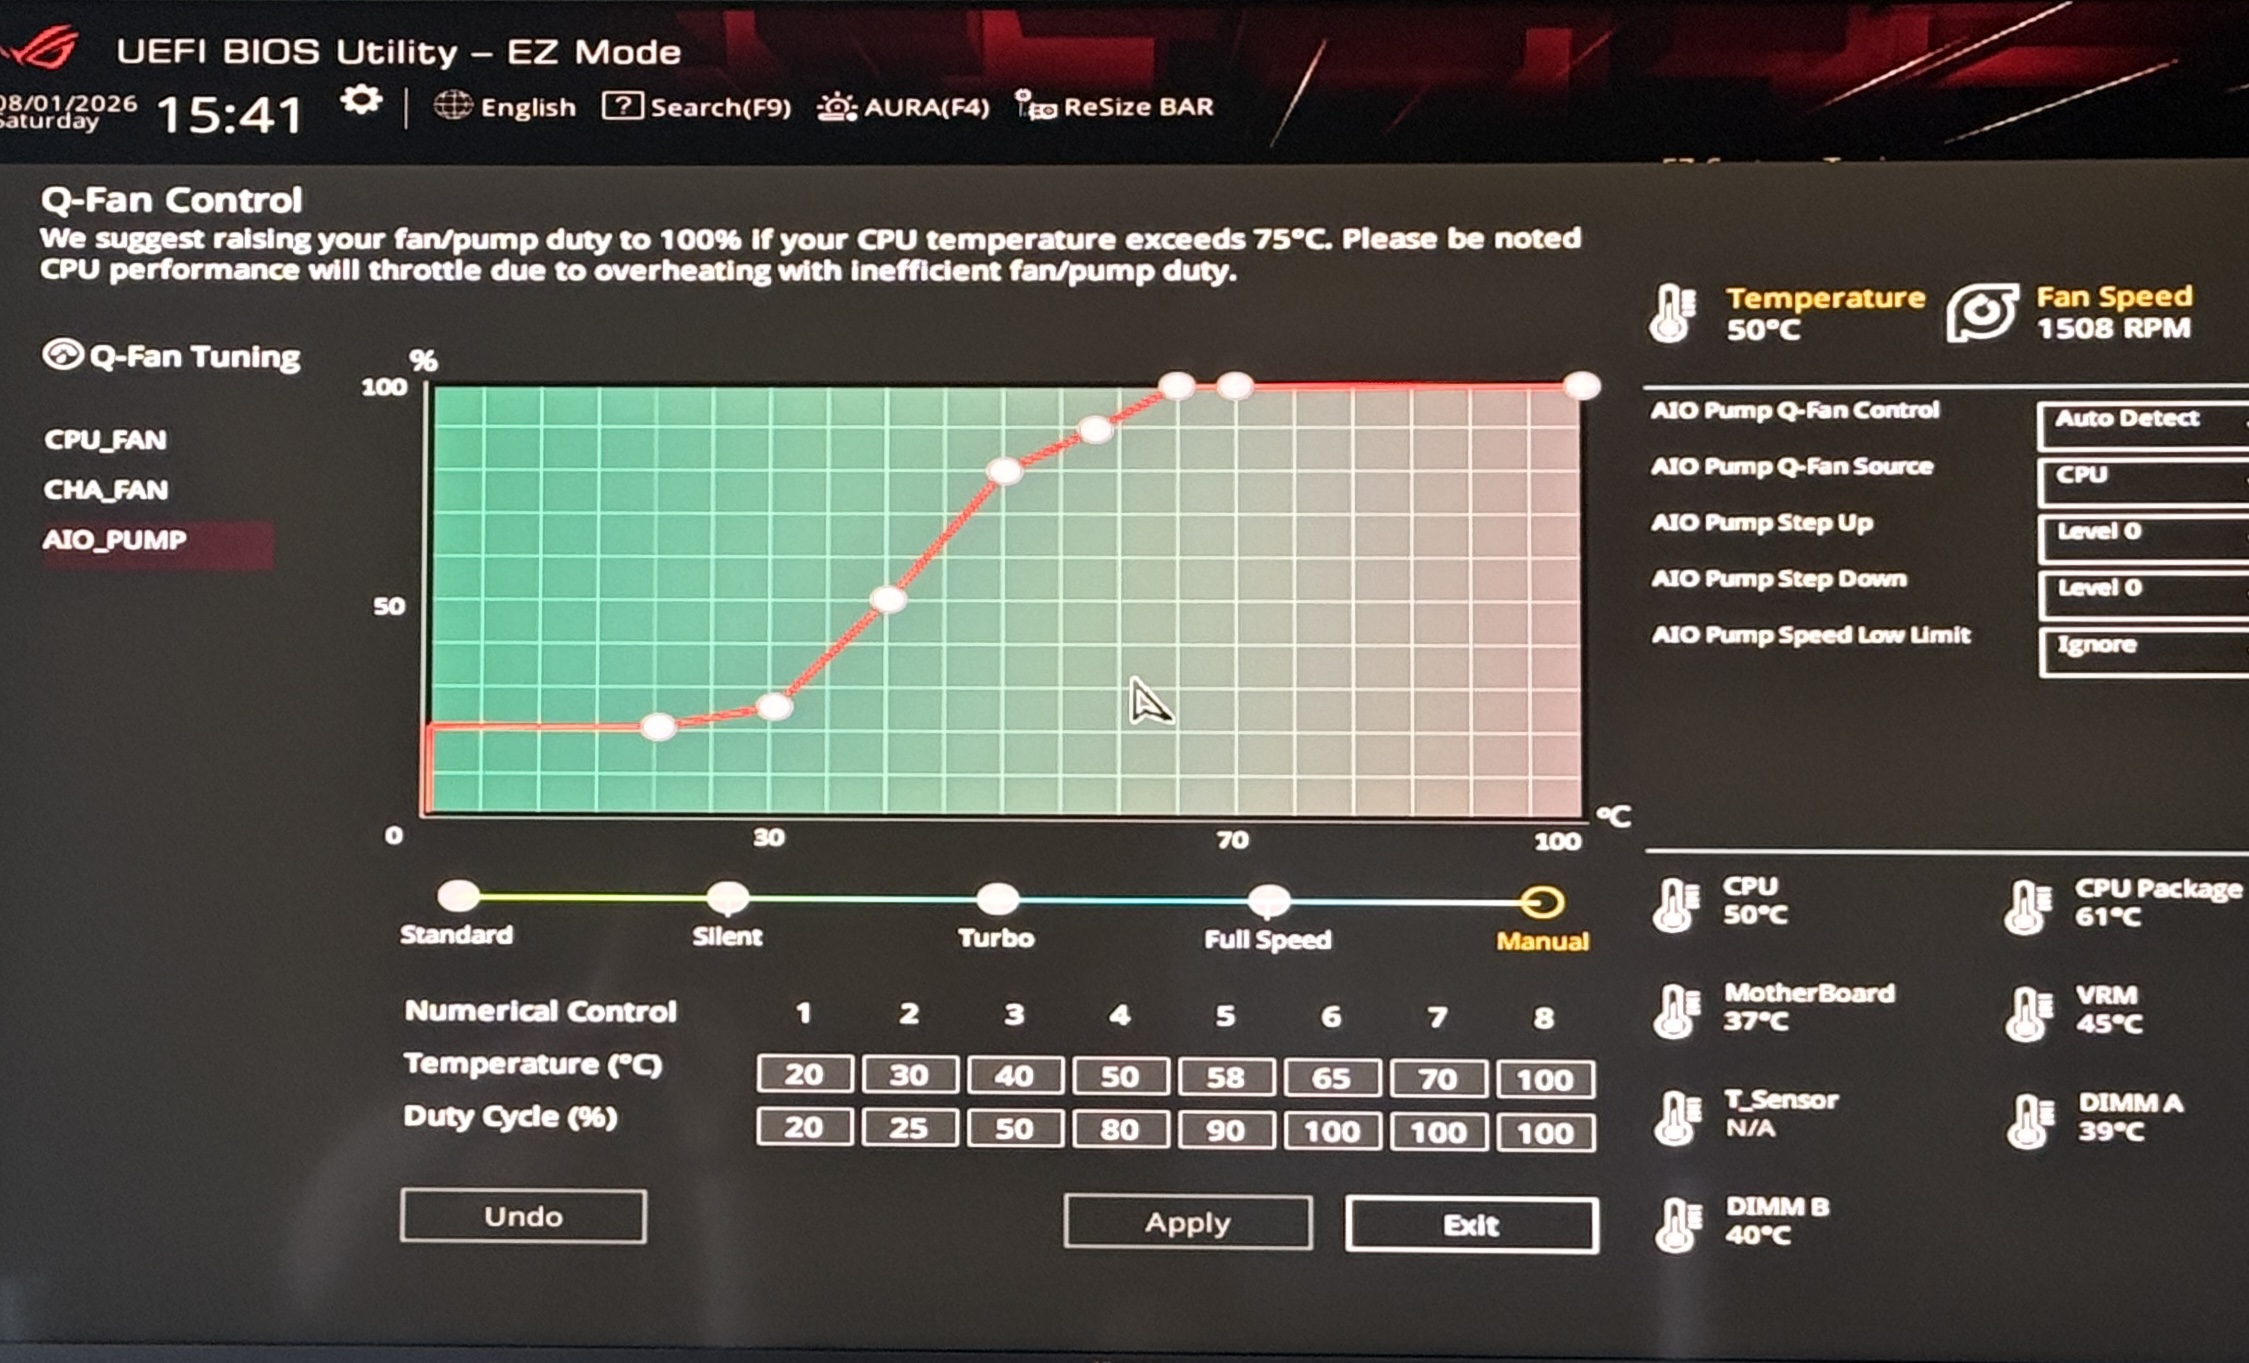
| Point | Temperature | Duty Cycle |
|---|---|---|
| 1 | 20°C | 20% |
| 2 | 30°C | 25% |
| 3 | 40°C | 50% |
| 4 | 50°C | 80% |
| 5 | 55°C | 90% |
| 6 | 65°C | 100% |
| 7 | 70°C | 100% |
| 8 | 100°C | 100% |
That’s a narrower quiet band and a steeper ramp than I remembered it as being: duty only stays low through the 20-30°C range, then climbs fast, hitting 80-90% by 50-55°C and pinning at 100% from 65°C on. Reran the harness a second time:
| Phase | Fan-Fixed Baseline Avg/Max | Broken Curve Avg/Max | Corrected Curve Avg/Max |
|---|---|---|---|
| idle | 37.3 / 60.0°C | 54.5 / 77.0°C | 46.5 / 64.0°C |
| cpu | 41.4 / 67.0°C | 59.9 / 87.0°C | 53.0 / 76.0°C |
| gpu | 50.9 / 60.0°C | 67.4 / 79.0°C | 62.3 / 73.0°C |
| combined | 55.3 / 73.0°C | 71.5 / 93.0°C | 69.1 / 88.0°C |
| storage | 57.5 / 66.0°C | 74.0 / 83.0°C | 71.7 / 82.0°C |
| cooldown | 39.5 / 56.0°C | 57.0 / 74.0°C | 47.8 / 73.0°C |
Meaningfully better than the broken version everywhere — 6 to 13°C improvement per phase, no more 90°C+ spikes, and GPU numbers unchanged from baseline throughout (67.5°C avg in gpu, 69.6°C avg in combined, both within a degree of the original fan-fixed numbers), confirming the GPU side of this was never part of the problem.
It’s not a full return to the original steep-ramp baseline, though. CPU package is still running 8-14°C warmer than the fan-fixed baseline across every phase, worst in the sustained-load phases: combined is +13.8°C average, storage is +14.2°C average. The curve’s mid-to-high range is softer than the original, just not broken anymore. Every number here is still comfortably under Arrow Lake’s ~100-105°C throttle point — combined tops out at 88°C, well short of danger — so this is a real, livable tradeoff rather than a problem. I’m keeping it. Quiet idle was the whole point of this last step, and I got it without cooking anything.
What I Learned
A flat, load-independent offset in a before/after comparison is a diagnostic gift. When the broken curve numbers above moved by almost exactly the same amount in every single phase — idle, full load, even the load-free cooldown — that was the tell. A real workload-driven effect grows and shrinks with the workload. A structural change to something upstream of all of them (in this case, an over-broad fan curve edit) shows up as a constant. When every phase moves together regardless of what the machine is doing, stop interrogating the workload and start re-checking what you actually changed.
Motherboard fan header telemetry doesn’t always tell the truth. Across all four runs, mobo_fan1 through mobo_fan7 RPM sensors read a flat 0 and their duty-cycle sensors read a flat 100%, regardless of what the fans were actually doing. LibreHardwareMonitor just doesn’t expose this board’s fan headers reliably in this context. I have thermal consequences of the fan curve changes, not direct fan-speed confirmation — worth remembering if you’re trying to reproduce this on your own board.
A scheduled task can stand in for a real desktop session, and it’s a pattern worth keeping in your back pocket any time you need a real interactive-desktop GPU (or any GUI) workload driven from an SSH-only automation context on Windows. Direct process launch over SSH quietly runs in a session the GPU never sees; schtasks /Run against a pre-configured task does not.
Chipset tier gates more than raw overclocking headroom. I went in assuming undervolting was a BIOS checkbox away. It turned out to be a feature Intel and ASUS both deliberately withhold below the Z-series tier, enforced consistently in the BIOS UI and in Intel’s own tuning software. That’s a useful thing to know before buying a board for a build where efficiency tuning matters, not just overclocking.
The single highest-leverage thing I did this entire month was turn a $15 fan around. Everything after that — the BIOS archaeology, the XTU dead end, the fan curve mistake and its fix — was chasing single-digit-to-low-double-digit degrees for real but much smaller returns, and one of those chases actively made things worse before I caught it. Stormtrooper runs cooler than it did a month ago, quieter at idle than it’s ever been, and I now know exactly which knobs this board does and doesn’t have — which, it turns out, is worth almost as much as the temperature drop itself.
By the Numbers
- 4 full thermal harness runs across a month
- 65 minutes per run: idle, cpu, gpu, combined, storage, cooldown
- -16.1°C average GPU temperature drop from turning one fan around
- -19.0°C peak GPU temperature drop from the same fix
- $0 spent to get there
- 10 BIOS menu locations and search results checked before concluding CPU undervolting isn’t exposed on this board
- 0 CPU voltage offset fields found, anywhere, including via Intel XTU
- 250W / 250W / 56s — this board’s PL1/PL2/Tau, which turned out to already be exact Intel stock, not the unlocked profile I assumed I’d be dialing back
- +17.2 to +18.5°C the uniform CPU penalty from a fan curve edit gone too broad
- 6-13°C recovered by narrowing that same curve back down
- 8 points in the final
CPU_FANcurve, pinned to 100% duty by 65°C - 1 gaming PC, finally both quiet at idle and not lying to me about its fan speeds under load