Smart Home, Dumb Luck, Episode 3: Hacking HACS and Tuning Kuma for Home Assistant Monitoring
Episode 2 ended with Uptime Kuma and AdGuard standing up, HACS still installed the wrong ad hoc way, and the Zigbee dongle stuck in transit. This session picks up with one specific question: how much of “install HACS properly” can an AI agent actually do without me touching a browser at all? The answer turned out to be almost everything, except the one step GitHub itself won’t let anyone script.
That’s the through-line for tonight. A real config bug made one browser tab lie to me for twenty minutes. A memory ceiling I didn’t know I’d hit nearly wedged the VM again. And nine new Uptime Kuma checks started paging me for a problem that wasn’t actually an emergency. All of it came out of just trying to finish what Episode 2 deliberately left undone.
HACS Installed without Ever Opening a Browser
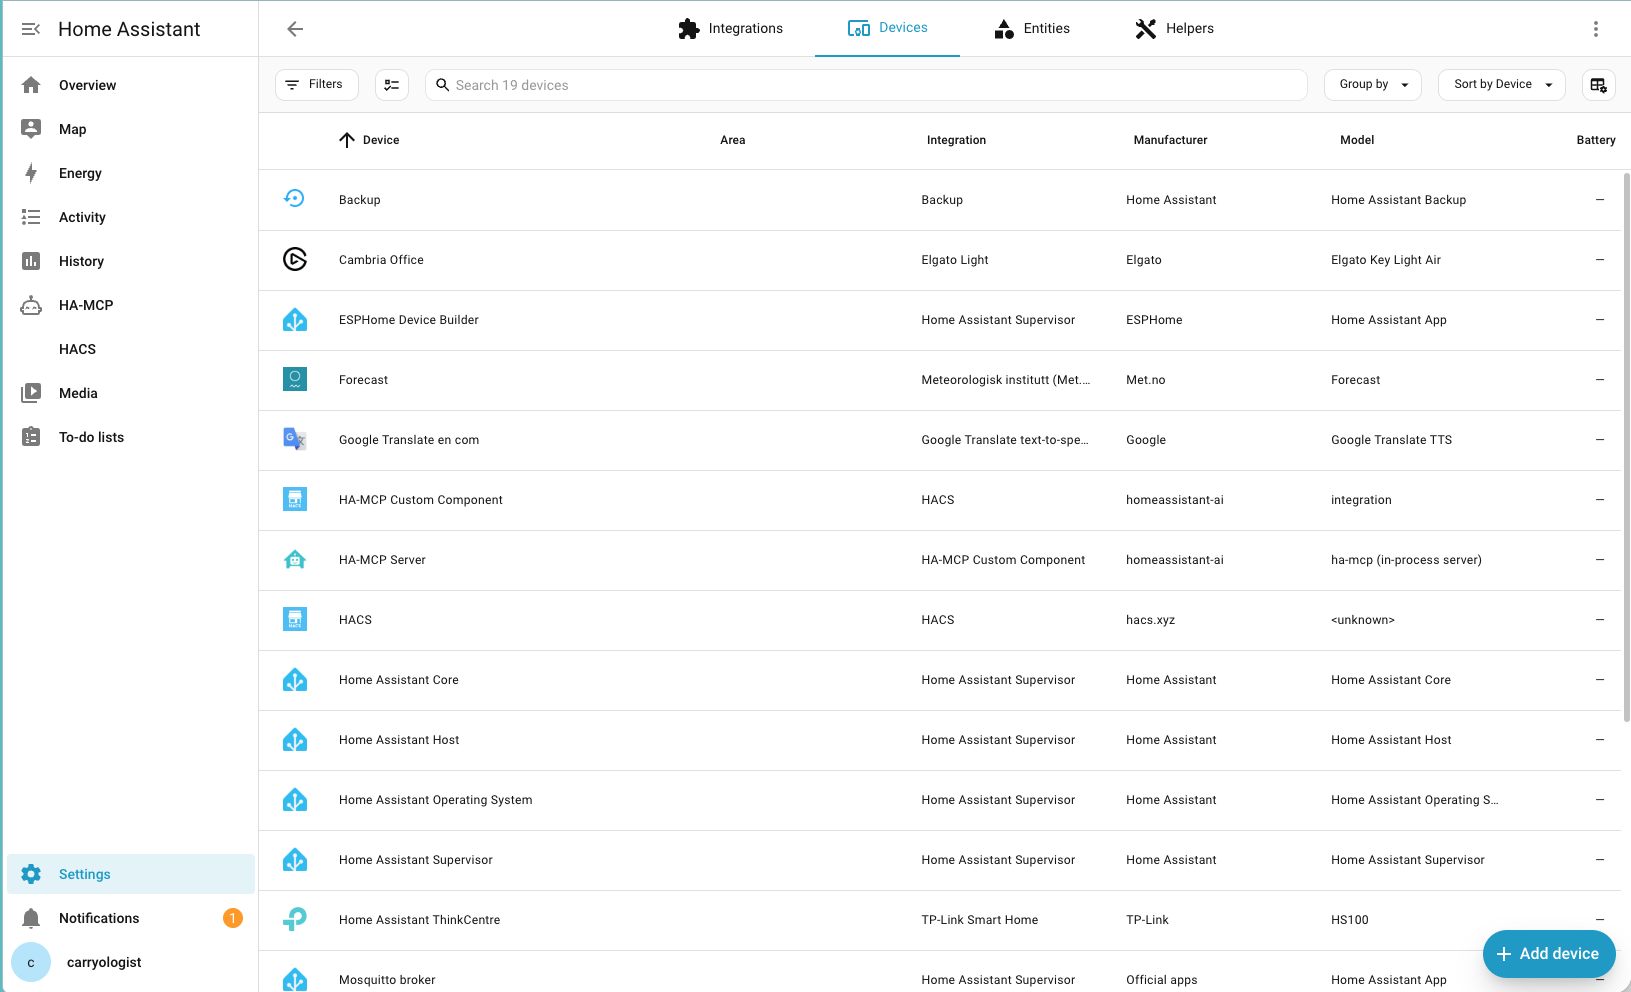
The ad hoc HACS install from Episode 2, copying files by hand through the QEMU guest agent, needed a proper redo. HACS itself recommends installing through its official script from inside the “Terminal & SSH” add-on. So the agent installed that add-on too, entirely from the command line: ha addons install core_ssh over the Supervisor’s own CLI, then a dedicated Ed25519 key pushed in through the Supervisor’s REST API, since the CLI in this Home Assistant version has no options-setter of its own.
From a real shell inside that add-on, the official HACS installer ran clean: wget -O - https://get.hacs.xyz | bash -. A Core restart later, HACS’s files loaded without complaint.
Here’s the part that couldn’t be automated. Finishing HACS setup means authorizing it against GitHub through a device-flow login, visit a URL, type a code, on my phone. No API call replaces a human looking at a screen and typing six digits. Everything up to that one step ran unattended. That one step needed me.
Ha-MCP Joins the Stack and a Secret Almost Leaks
With HACS live, the agent added ha-mcp as a custom repository (its HACS mirror, specifically) and downloaded it, not through a browser, but by talking to HACS’s own WebSocket API directly with a Python client, authenticated with a long-lived Home Assistant token I generated myself. First token I made turned out invalid, probably a clipboard miss on my end. Second one worked.
Then I told the agent to write up the session in our running plan doc, which lives in this blog’s own content repo. It committed the live MCP connect URL, the actual bearer secret, in plain text. Caught before it mattered. The repo is private, and we amended and force-pushed the commit within minutes of it landing, but it’s a clean example of exactly the kind of mistake worth catching immediately rather than shrugging off because “it’s private anyway.” The fix going forward is simple. Secrets live in a local file on the workspace, and docs only ever reference the file path.
A Fresh Tab Refuses to Connect
Then Home Assistant just stopped answering. A brand new browser tab, a different browser entirely, both got connection refused on port 8123. My one already-open tab from earlier kept working like nothing happened, which made zero sense if the server was actually down.
It wasn’t down. It had moved. Home Assistant’s own http component had server_port: 80 baked into its storage file, not the usual 8123, so anything new landed on the wrong port while my one live tab’s existing TCP connection didn’t care what was listening now. I chased a hairpin-NAT networking theory first, based on an old known quirk with this box, and it was a red herring. The actual fix was two lines: ha core options --port 8123 on the Supervisor side, then a direct edit of the stored port value Home Assistant itself was actually reading. One restart later, the new tab connected fine.
173 Megabytes of Free Memory
A quick look at the Proxmox dashboard turned up something worth fixing before it became a real problem. The Home Assistant VM was sitting at 93% of its 6GB allocation, about 173 megabytes free, with no swap file inside the guest at all. Every add-on we’d just installed had been quietly eating into a ceiling nobody was watching.
Bumping it to 8GB and rebooting the VM brought it back to a healthier 2.5GB free. The host itself has 16GB total and plenty of room to spare for now, the bigger RAM upgrade this box eventually needs is still a physical, in-person job for move day.
Mosquitto Esphome Node-RED and One SSL Crash Loop
The three Supervisor add-ons that don’t need the Zigbee dongle went in next: Mosquitto (the MQTT broker other integrations will lean on later), ESPHome (for flashing custom sensors), and Node-RED (a visual automation builder, more flexible than Home Assistant’s native automations UI once things get complicated).
Two installed clean. Node-RED didn’t. It ships defaulting to ssl: true with no certificate file configured, so it crash-looped on its very first boot. There’s no reason to terminate TLS at that layer on a box that’s Tailscale-only anyway, so flipping ssl to false through the Supervisor’s options API fixed it in one shot.
Uptime Kuma Finally Earns Its Keep
Uptime Kuma had been sitting installed since Episode 2 without watching anything. This session wired up four real monitors: HAOS itself, AdGuard, the Proxmox host, and a cron-driven memory check for the VM.
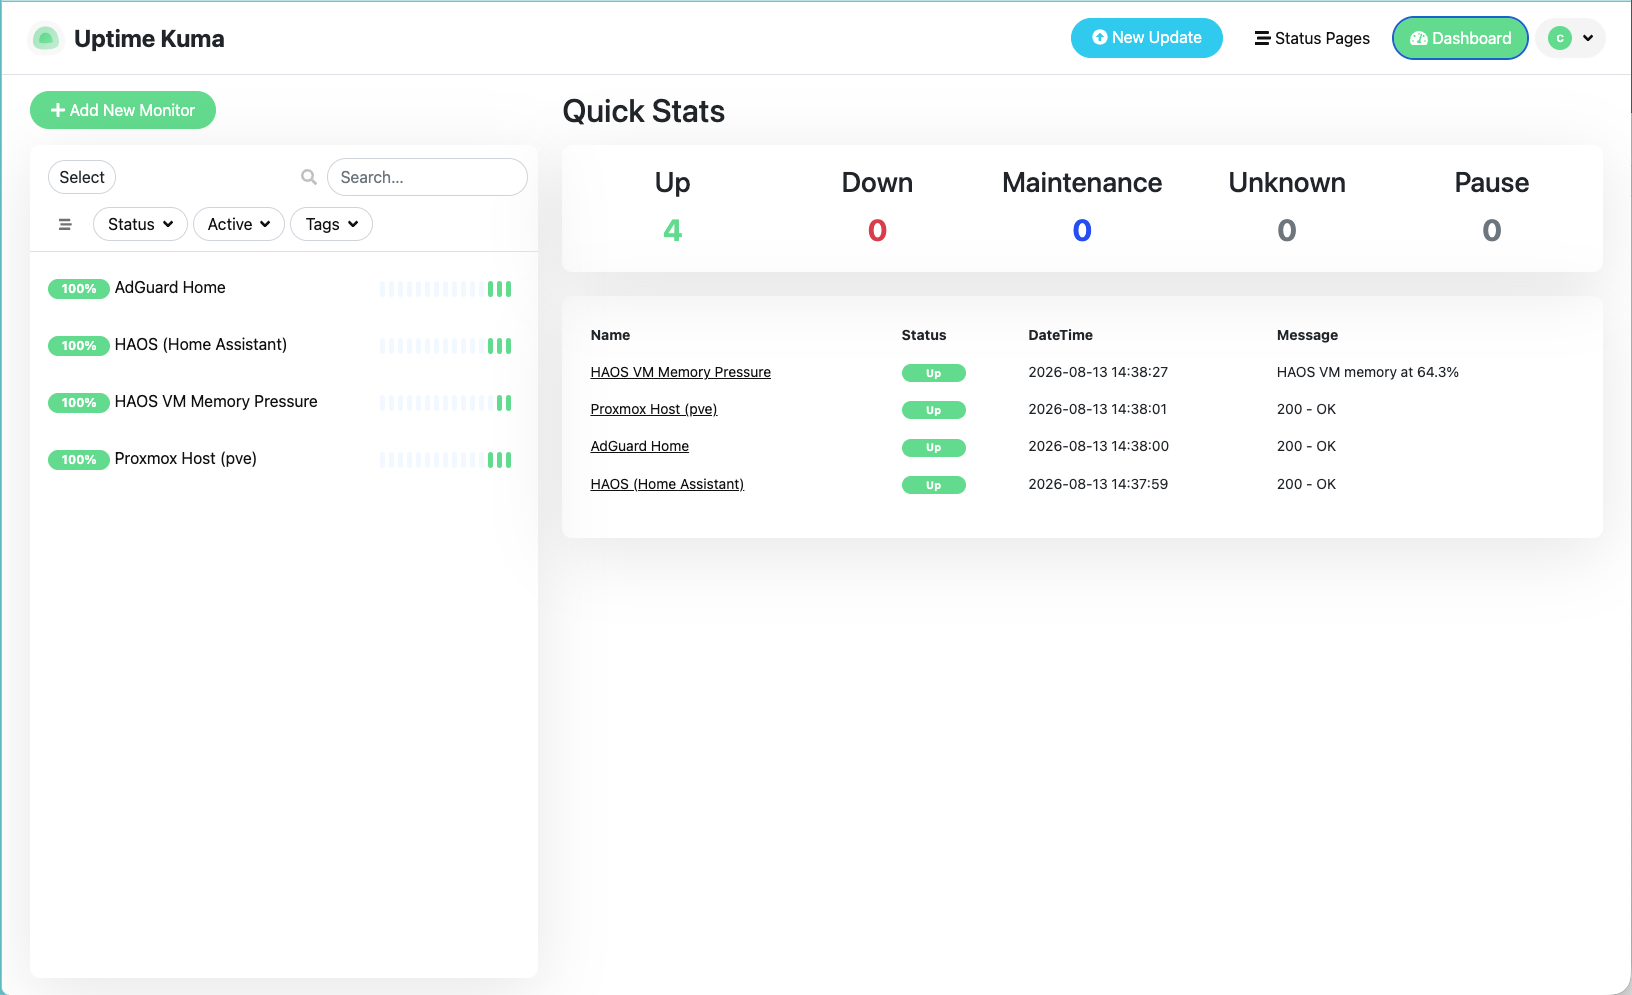
That last one needed its own workaround. Kuma’s JSON Query monitor type only does plain string-equality comparisons, no numeric operators, so there was no clean way to say “alert if memory usage crosses 90%.” Kuma’s Push monitor type solved it instead: a cron job on the Proxmox host computes the real percentage itself and reports up or down directly.
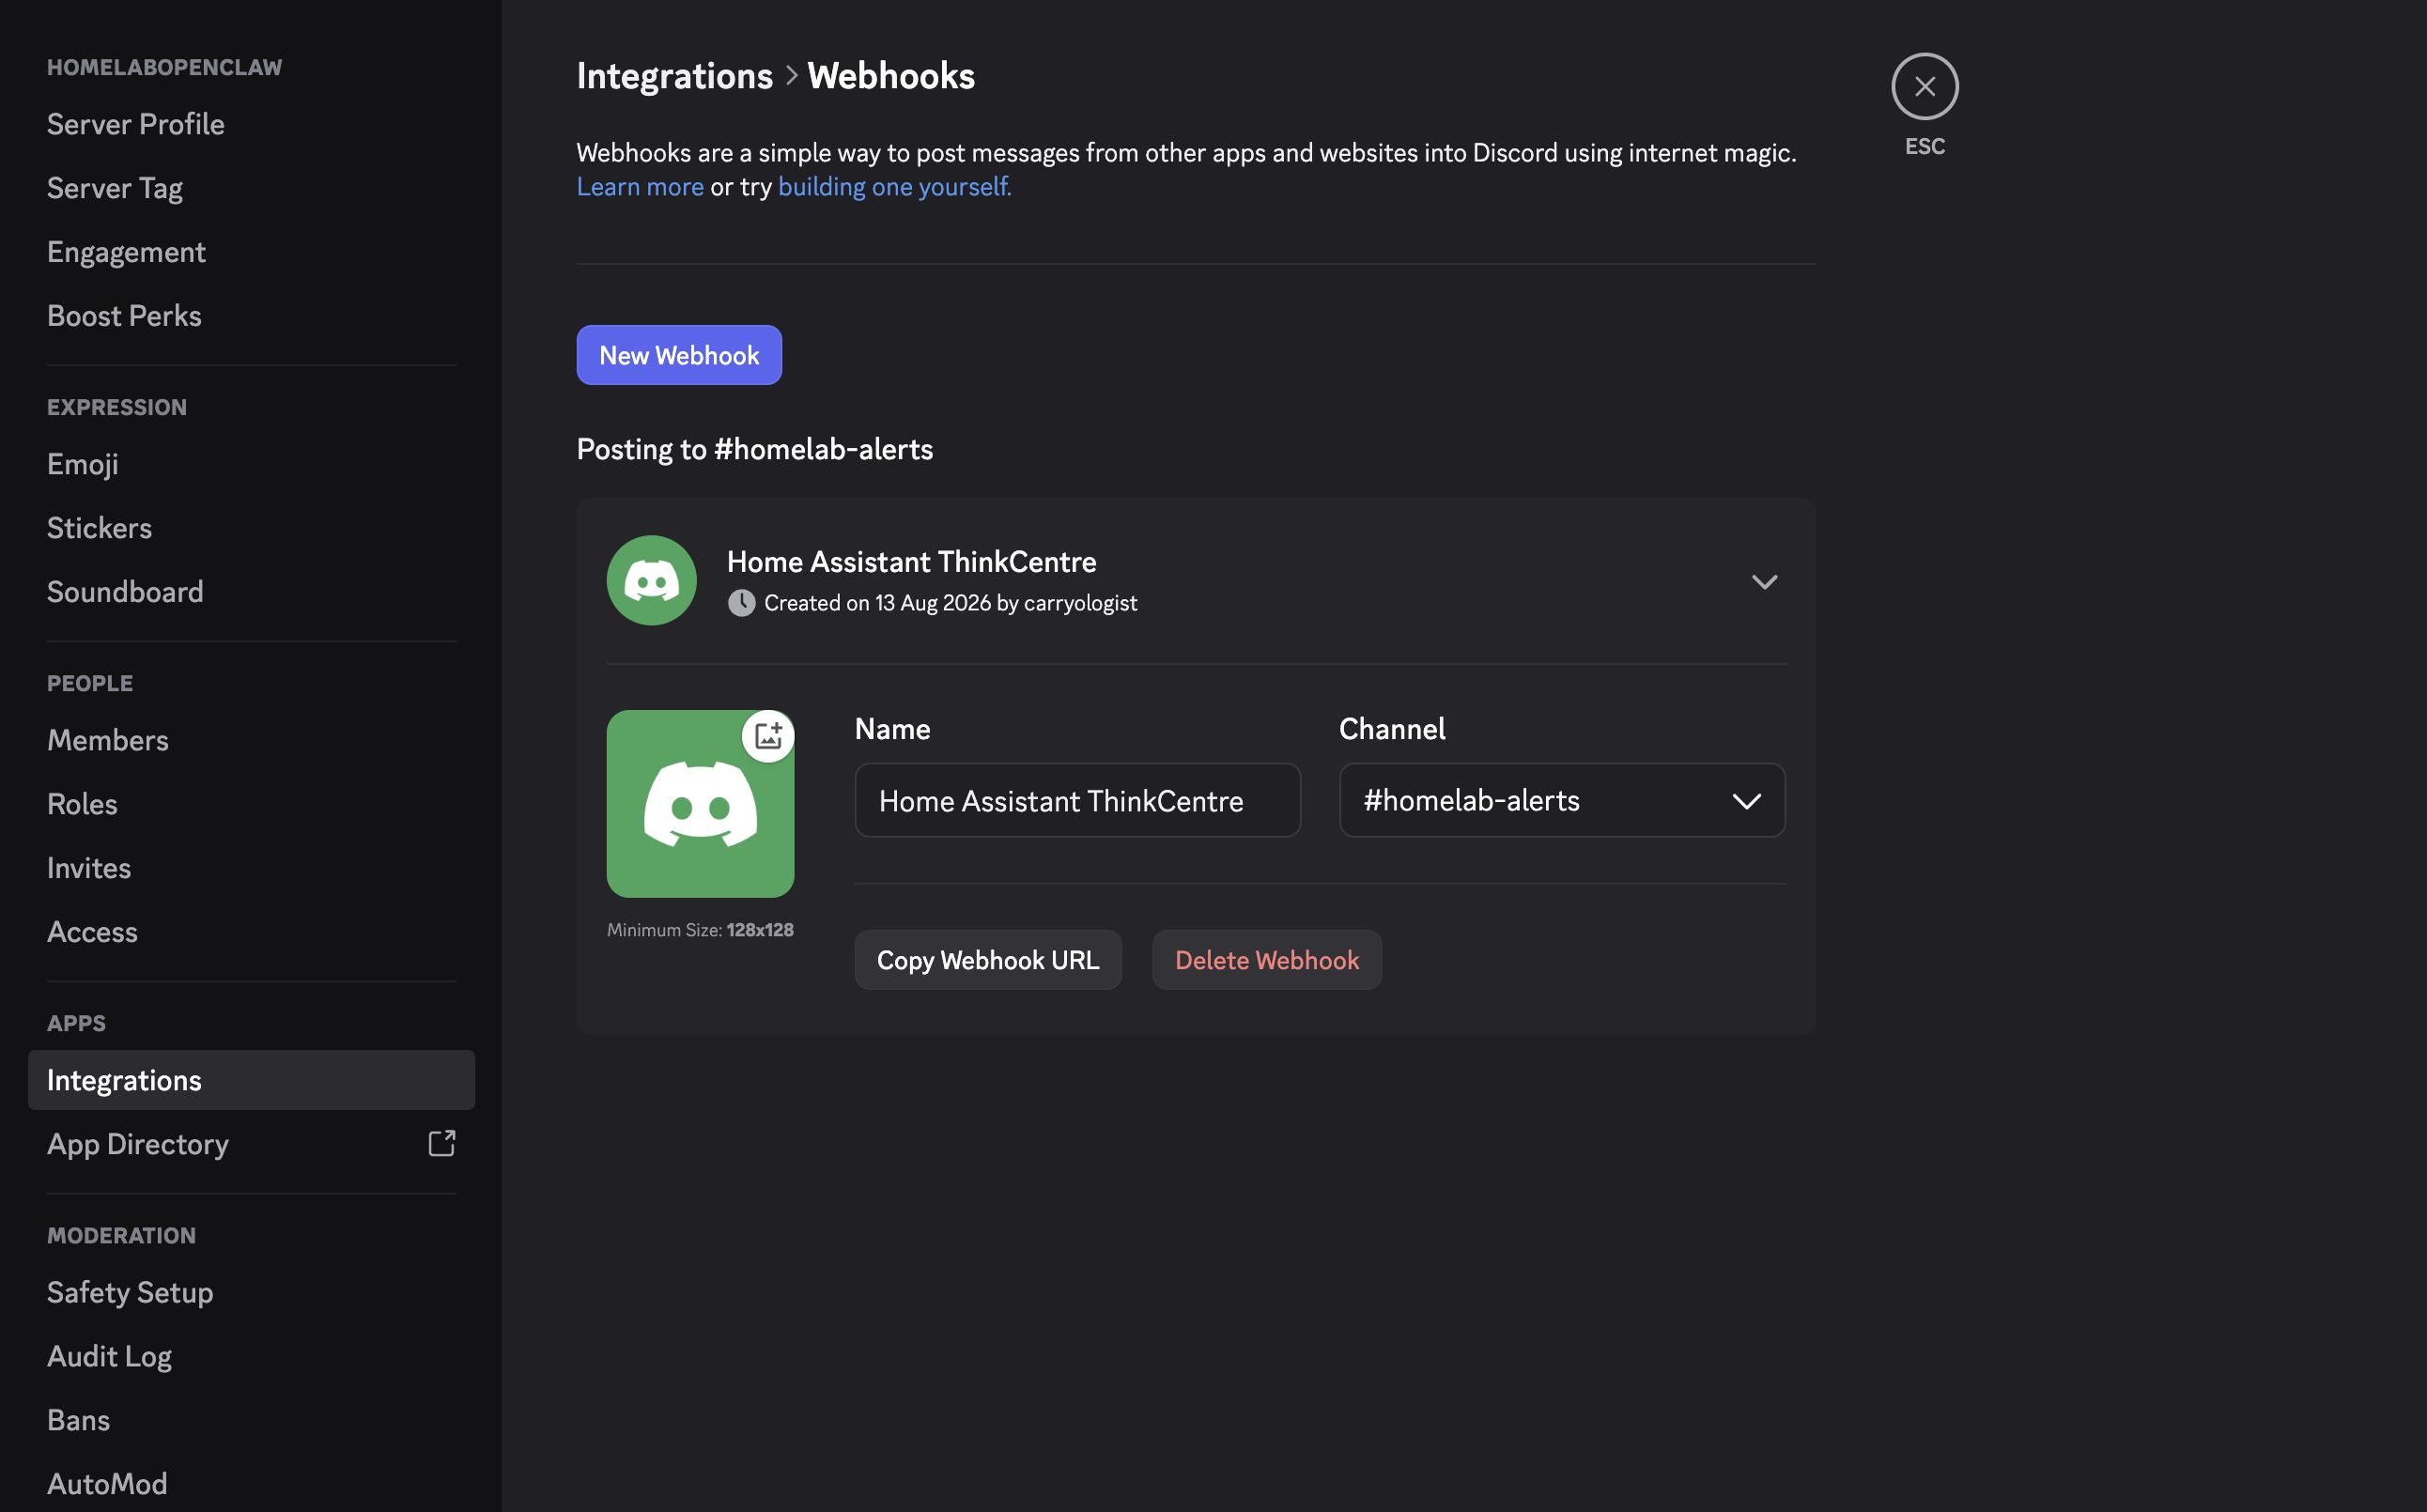
For alerting, I’m moving this project off Slack toward Discord, since I already run a server there for chatting with OpenClaw. A Discord webhook took thirty seconds to create and wire in.
Five More Checks Expose a Missing PATH
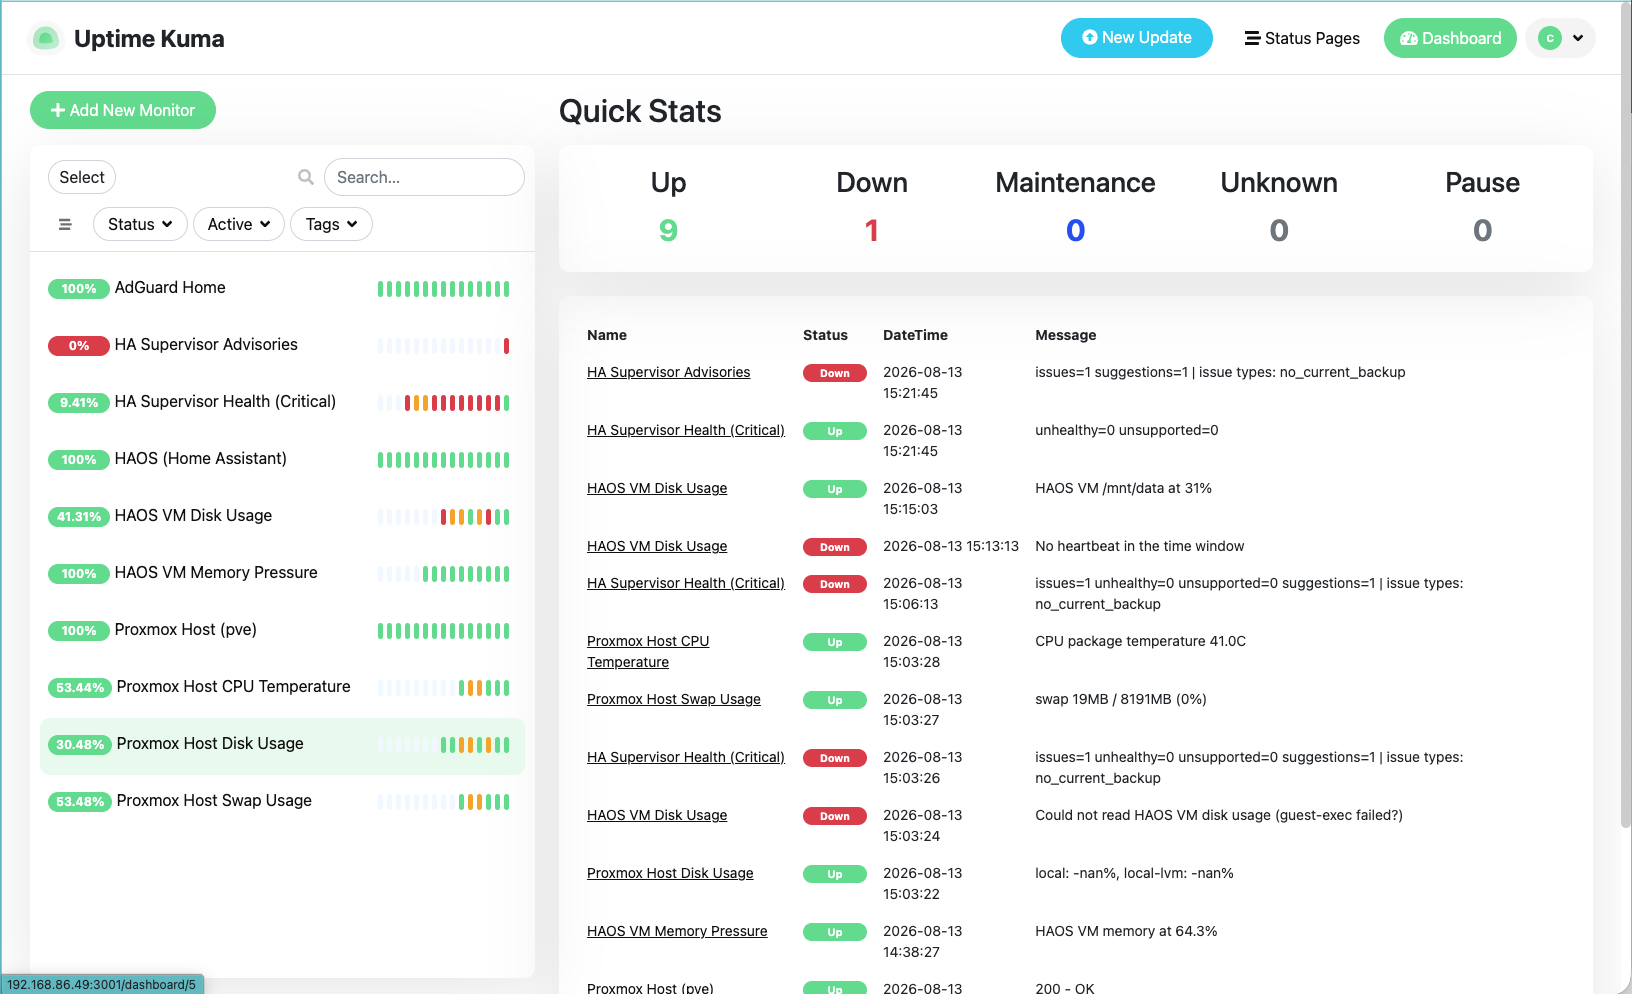
Riding the momentum, I asked for five more checks: Proxmox’s own disk usage, the VM’s real data partition, Home Assistant’s self-reported Supervisor health, host swap usage, and CPU temperature (which meant installing lm-sensors fresh).
All five worked when I tested them by hand over SSH. Three of them failed the moment cron actually ran them.
The cause was almost insulting given how much time it cost. pvesm and qm, the actual Proxmox tools two of the scripts depend on, live in /usr/sbin, and root’s personal crontab had no PATH line of its own. Cron falls back to a bare default that doesn’t include /usr/sbin, so those commands silently weren’t found at all. An interactive SSH session hides this completely, since its shell PATH is far richer than cron’s ever is. One PATH= line fixed all three at once. It’s a small, boring bug, and also exactly the kind that only shows up once something is actually running unattended on a schedule, which is the whole point of building it in the first place.
Not Every Down Deserves a Page
The Supervisor health check immediately found something real. Home Assistant’s own resolution center flags that automatic backups aren’t confirmed working. Correct finding, wrong severity. It alerted to Discord as a flat “down” every five minutes for something that’s an advisory, not an outage.
I asked whether Kuma had a middle state, something like orange, short of a full outage. It doesn’t. I tested it directly, pushing status=pending at the raw API, and Kuma silently coerced it to “down” anyway. Push monitors are strictly binary. The real fix was splitting one monitor into two: a Critical monitor that only alerts on Supervisor’s own most severe categories, and a separate Advisories monitor that stays visible on the dashboard but never pages anyone. Worth remembering for anything else that reports its own health: “something’s true” and “something’s broken” are not the same alert.
What’s Next
Everything left in the plan is now blocked on one thing: being physically at the permanent home with the Sonoff Dongle Plus MG24 in hand, pairing Zigbee devices, building the Wake-on-LAN button flow, and finally decommissioning SmartThings for good. One idea already queued for whenever that happens. Since the AI workstation isn’t always on, a normal Kuma monitor would falsely alert every time it’s deliberately shut down. The fix is pausing and resuming that monitor automatically, off the same presence sensor already driving the Wake-on-LAN button, probably through Node-RED, which would be its first real job instead of just sitting installed.
By the Numbers
- 1 GitHub device-flow login that had to stay a human step, no way around it
- 1 live secret committed to git and scrubbed within minutes via an amended, force-pushed commit
- 173MB of free memory left inside the Home Assistant VM before the RAM bump
- 6GB → 8GB the VM’s new memory allocation
- 1 Supervisor add-on (Node-RED) that shipped defaulting to SSL with no certificate and crash-looped on first boot
- 9 Uptime Kuma monitors now actually watching something, up from zero at the start of the night
- 3 of those monitors that silently failed under cron despite working fine over interactive SSH, one missing
PATHline away from fixed - 0 genuine orange/warning states Uptime Kuma actually supports, confirmed by testing it directly